Measure Performance Details
Last updated November 19, 2025
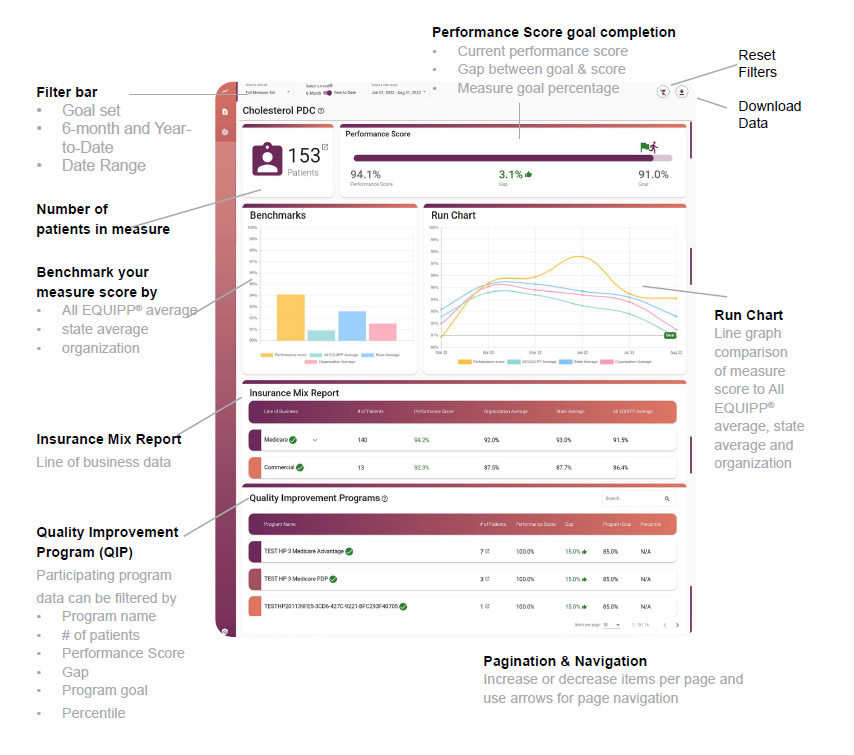
A Closer Look at the Measure Performance Page
The Measure Performance Screen provides detailed information about your pharmacy's selected quality measure score, visual comparisons of your pharmacy's performance against others, and a granular view of your pharmacy's performance within specific performance programs and health plans. This detailed view can be found for each measure by clicking on the measure name within the Performance Dashboard.
Measure Performance Features:
| Goal Set - Select the goal set you wish to view for the specified measure | Performance Score Goal Completion: Current Performance Score, Gap between goal & score, and Measure goal percentage |
| Select a Trend - Select a measure trend: 6-month or Year-to-Date (YTD) | Insurance Mix Report - The lines of business your pharmacy has data for within a specific measure. |
| Select a Date Range - Select the data date range to view historical or current performance data. | Quality Improvement Program (QIP) - Displays performance program-specific details, scores, goals, patient counts, and percentile rankings |
| Number of Patients in the Measure - Total number of patients who meet the eligibility requirements and are included in the denominator of the measure. | Download Data- Download and save the data on the selected page |
| Pagination & Navigation- Increase or decrease items per page and use arrows for page navigation | Reset Filters- Removes applied filters and resets to the default view |
Run Chart: This chart will show the historical changes in comparison to the displayed averages:
- State - Average of all the pharmacies within the same state
- Organization - Average of all the pharmacies within the same chain or organization
- All EQUIPP® - Average of all the pharmacies currently displaying within EQUIPP
The Quality Improvement Programs Table (QIP)
The Quality Improvement Programs (QIP) table contains detailed information for each performance program. This information includes the total number of patients, performance scores, each program-specific goal, the gap to performance score goal, and the percentile where applicable.

You can sort any column here to direct your efforts. The color-coded icons in the table should be used for performance guidance.
Green checks next to the program name indicate the goal has been met along with the green thumbs up in the gap column.
A red thumbs down means you have not met the program goal, and displays the percentage gap needed to close so you can achieve the program's expected goal.
Each program will display the square and arrow icon which navigates to the patients impacting the specific program in the indicated measure.
Take Action!
- Establish a quality champion who will engage with the data in EQUIPP.
- Review each performance measure detail monthly.
- Track your progress towards health plan goals through the QIP table.
- Understand your benchmarks in relation to network expectations.
- Engage with patients attributed to specific measures to improve performance.